Curriculum
- 7 Sections
- 73 Lessons
- 7 Days
Expand all sectionsCollapse all sections
- Day 1: Introduction to Technical Analysis10
- 1.1Introduction to Technical Analysis
- 1.2Key differences between fundamental analysis and technical analysis-What is undamental Analysis ?
- 1.3Key differences between fundamental analysis and technical analysis-What is Technical Analysis ?
- 1.4What are the Key Differences between Fundamental Analysis and Technical Analysis?
- 1.5Advantages and limitations of technical analysis
- 1.6Basic principles and assumptions of technical analysis
- 1.7What is the Dow Theory?
- 1.8The six basic tenets of the Dow Theory
- 1.9Applications of Understanding the Market Cycle
- 1.10The Psychological Ebbs and Flows of Market Cycles
- Day 2: Chart Types and Patterns11
- 2.2Understanding different chart types- line chart
- 2.3Understanding different chart types – bar chart
- 2.4Understanding different chart types- candlestick chart
- 2.5Introduction to price patterns-trends
- 2.6Introduction to price patterns-support and resistance levels
- 2.7price patterns-trends, support and resistance levels plotted together
- 2.8Recognizing common chart patterns (e.g., head and shoulders, double tops/bottoms)
- 2.9Using patterns to identify potential price reversals and continuations
- 2.10Time Frame Selection
- 2.11Scale selection on charting software
- 2.12Charting Software for Analysis
- Day 3: Technical Indicators18
- 3.2Introduction to technical indicators (lagging and leading indicators)
- 3.3Trend indicators
- 3.4Momentum indicators
- 3.5Volatility Indicators
- 3.6Volume Indicators
- 3.7Popular indicators: Moving Averages
- 3.8Popular indicators: , Relative Strength Index
- 3.9Popular indicators: MACD
- 3.10Popular indicators: Stochastic Oscillator
- 3.11Popular indicators: ADX
- 3.12Popular indicators: Bollinger Band
- 3.13Interpretation and application of indicators-Trend Identification
- 3.14Interpretation and application of indicators-Confirmation and Validation of Trend
- 3.15Interpretation and application of indicators-Over bought & Oversold Signals
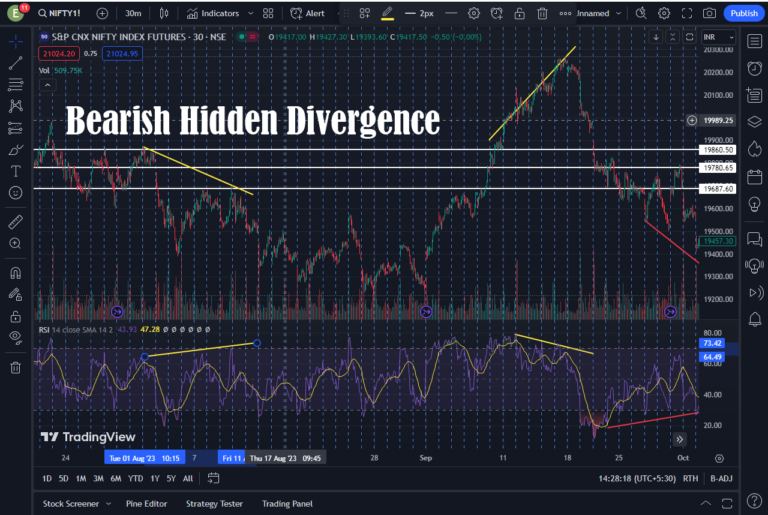
- 3.16Interpretation and application of indicators-Divergence
- 3.17Interpretation and application of indicators-Time frame Consideration
- 3.18Interpretation and application of indicators-Understanding Indicati=ors Limitations
- 3.19Combining multiple indicators for confirmation signals
- Day 4: Trendlines and Support/Resistance15
- 4.1What is trend?
- 4.2How to Identify Trend?
- 4.3Types of Trend-Uptrend, Downtrend & Sideways
- 4.4Drawing trendlines and understanding their significance-Identifying the overall trend
- 4.5Drawing trendlines and understanding their significance-Support and resistance levels
- 4.6Drawing trendlines and understanding their significance-Trendline breaks
- 4.7Drawing trendlines and understanding their significance-Trendline channels
- 4.8Drawing trendlines and understanding their significance-Trendline confluence
- 4.9Drawing trendlines and understanding their significance-Timeframes and trendline validity
- 4.10Identifying and confirming trend reversals
- 4.11Using support and resistance levels to make trading decisions
- 4.12Dynamic support and resistance (moving averages, trend channels)
- 4.13Pivots as Support & Resistance
- 4.14SECRET OF DRAWING TREND LINE
- 4.15SECRET OF DRAWING SUPPORT AND RESISTANCE
- Day 5: Volume Analysis and Market Breadth12
- 5.2Importance of volume in technical analysis
- 5.3Confirmation of Price Trends-Importance of volume in technical analysis
- 5.4Volume and Breakouts-Importance of volume in technical analysis
- 5.5Support and Resistance Levels-Importance of volume in technical analysis
- 5.6Divergence-Importance of volume in technical analysis
- 5.7Price Reversals and Exhaustion-Importance of volume in technical analysis
- 5.8Confirmation of Patterns and Indicators-Importance of volume in technical analysis
- 5.9Early Warning Signals-Importance of volume in technical analysis
- 5.10Volume indicators: On-Balance Volume (OBV)
- 5.11Volume indicators: Volume Weighted Average Price (VWAP)
- 5.12Interpreting volume patterns and their significance
- 5.13Overview of market breadth indicators (Advance-Decline Line, McClellan Oscillator)
- Day 6: Risk Management and Trade Execution4
- Day 7: Putting it All Together3